Hexo Corp. (NYSE:HEXO) rallied Wednesday amid an announcement that company's Masson-Angers cultivation campus received the Control Union Medical Cannabis Standard certification. This certification is the leading standard for medical cannabis cultivation, Hexo said.
Hexo gained 12.91% Wednesday, closing at $6.56.
Here's a technical look at the stock chart. 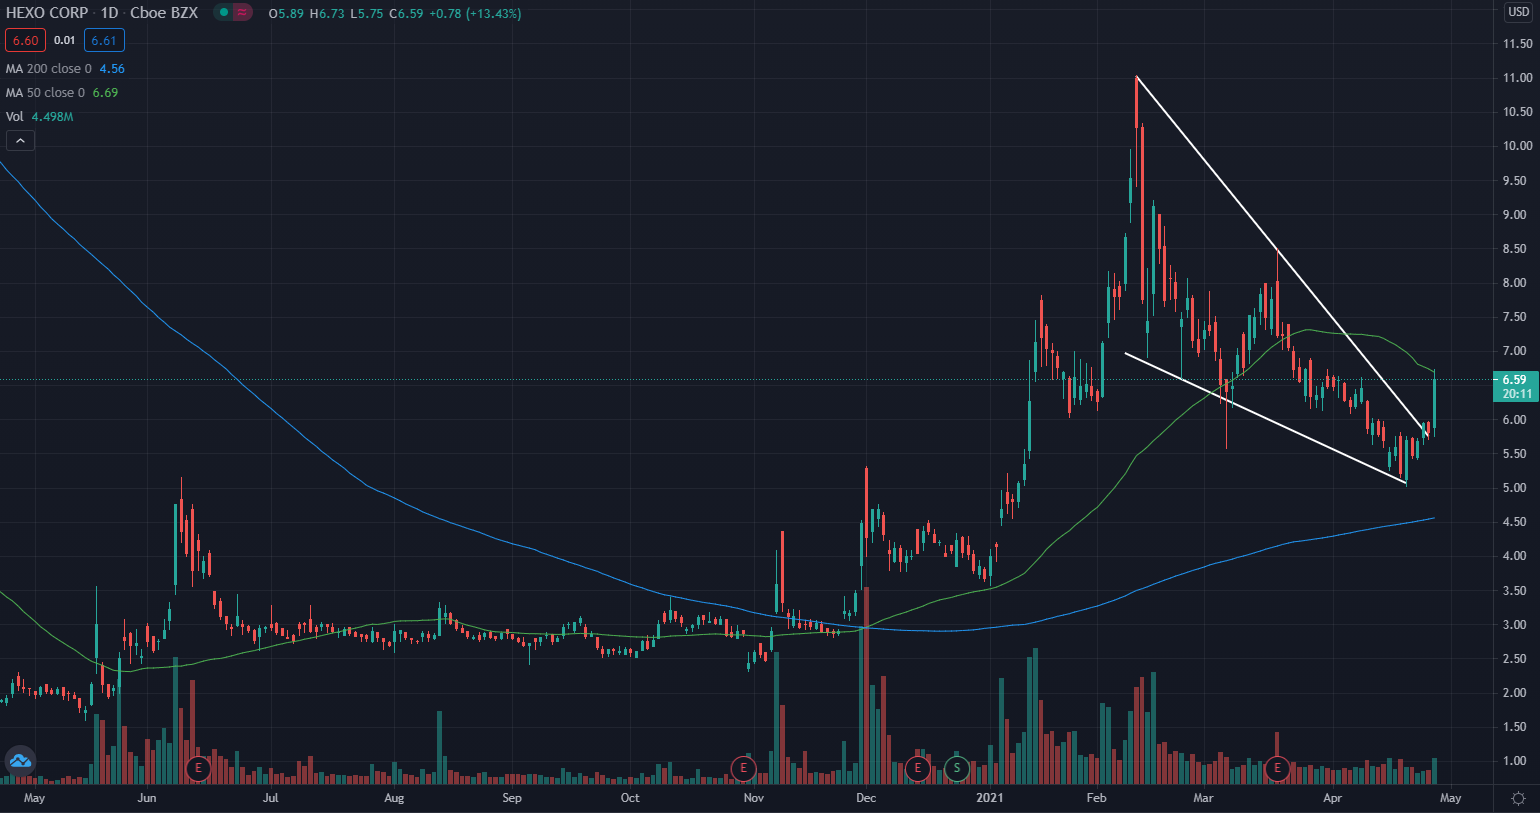
Hexo Daily Chart Analysis
- The stock is nearing the end of what technical traders call a falling wedge pattern.
- The stock is trading below the 50-day moving average (green) and above the 200-day moving average (blue), indicating the stock is most likely facing a period of consolidation.
- The 50-day moving average may hold as a place of resistance on the chart and the 200-day moving average is a potential area of support.
Key Hexo Levels To Watch
- The stock has been falling in recent months, forming what technical traders call a falling wedge pattern.
- This pattern is considered a bullish reversal pattern, as connecting the highs shows a much steeper drop versus connecting the lows of the chart, forming a wedge.
- A break above the line connecting the highs may signal the stock is changing trends and ready to start heading back up. For Hexo, Wednesday saw the price cross above the line connecting the highs. This is a hopeful sign for traders looking to see the stock start moving higher.
- A break below the line connecting the lows could bring about a stronger downward push.