Virgin Galactic Holdings Inc. (NYSE:SPCE) stock shot up over 11% in the after-hours session Thursday after the company printed its second-quarter earnings and announced it was reopening reservations and sales. The company also said it plans to complete its next test flight in September.
Traders and investors were likely most excited the space tourism company appears to be nearing the ability to launch commercial flights and generate real revenue.
For the second quarter, Virgin Galactic posted revenue of just $571,000, which beat the consensus estimate of $380,000, and an earnings per share loss of 39 cents, which missed the estimate of a 33-cent loss.
Virgin Galactic wasn’t able to hold its after-hours gains in the premarket session Friday and dropped back below a key resistance level.
See Also: How to Buy Virgin Galactic Stock
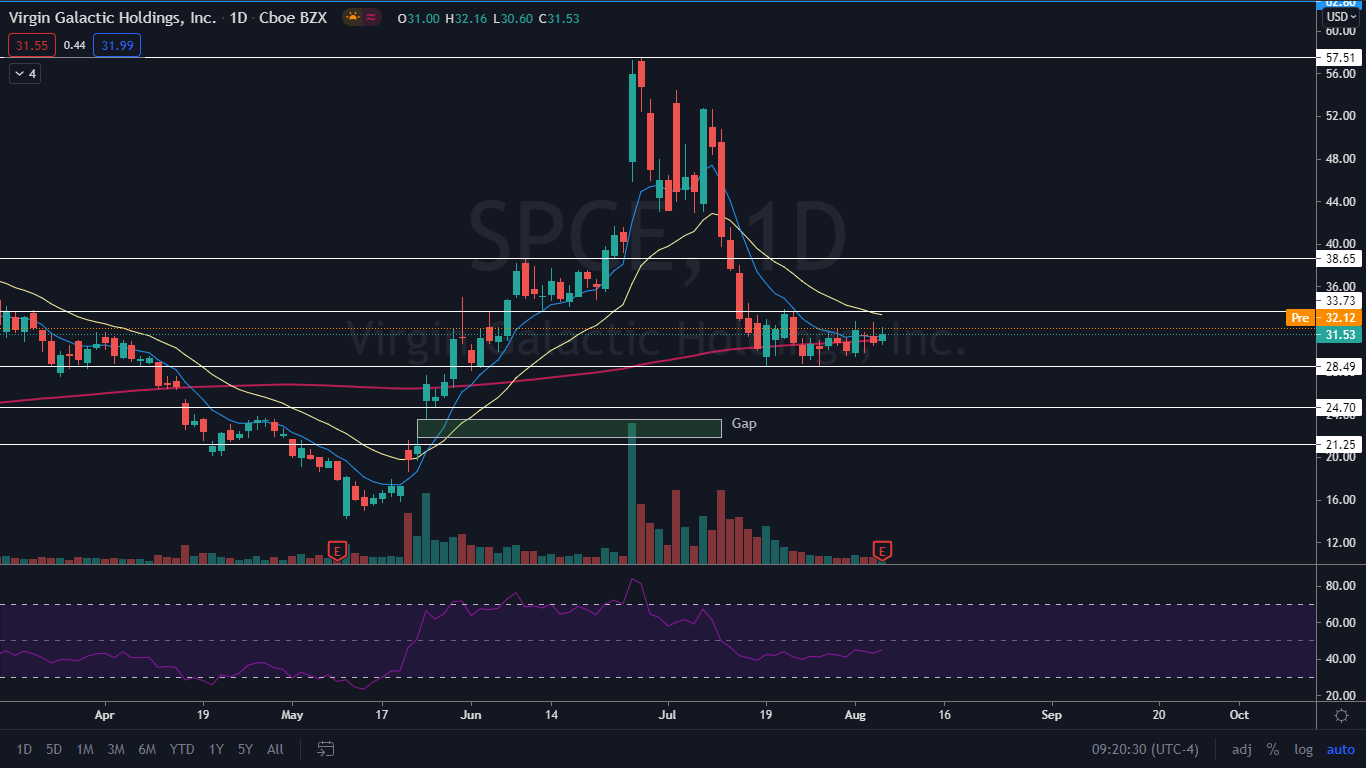
The Virgin Galactic Chart: When Virgin Galactic completed its last successful test mission with Sir Richard Branson on board, the stock shot up to a new high of $57.51 before falling 42% over the next 12 trading days and losing a key resistance and support level at $33.73. Virgin Galactic has not been able to close back up above for the past 16 trading days.
Virgin Galactic’s volume has been decreasing on the daily chart, which means there has been both a lack of buyers and a lack of sellers. This has caused the stock to trade sideways in a tightening range. Traders and investors will be watching to see if big bullish volume comes in on Friday to break Virgin Galactic out of the sidesways range.
There is a gap below, between $21.84 and $23.52, on Virgin Galactic's chart. Because gaps are filled 90% of the time, it is likely Virgin Galactic will trade back in that range at some point in the future.
The stock is trading slightly above the eight-day exponential moving average (EMA) but below the 21-day EMA, with the eight-day trending below the 21-day, which leans bearish.
Virgin Galactic is trading above the 200-day simple moving average (SMA), which indicates overall sentiment is bullish. The 200-day SMA is also acting as support for the stock.
- Bulls want to see big bullish volume come in and break Virgin Galactic’s stock up above $33.73, which would allow the stock to regain the 21-day EMA. If it can regain the levels as support, it has room to launch back up to the $38.65 level.
- Bears want to see Virgin Galactic continue to reject the upper resistance level and for big bearish volume to drop the stock down below the eight-day EMA and 200-day SMA. If the stock loses the levels as support, it could fall to $28.49.